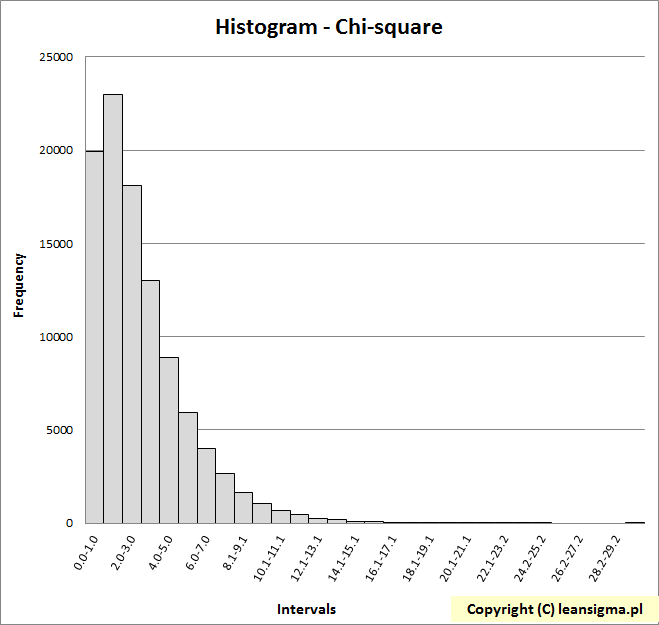
Histogram Example - Chi-square distribution
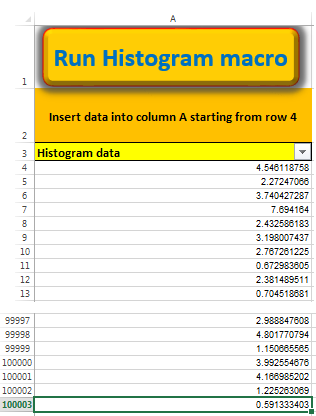
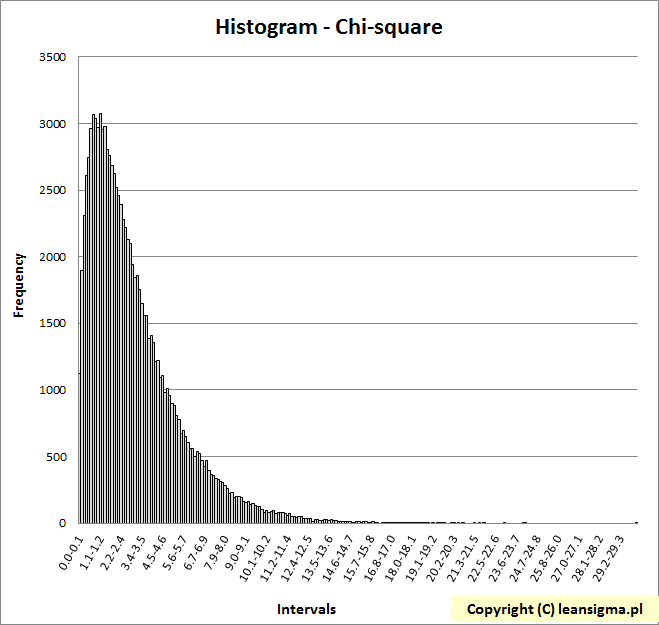
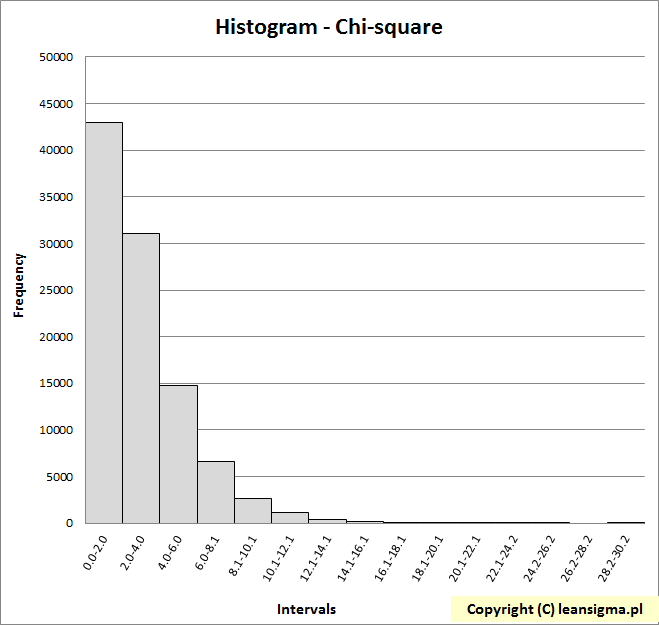
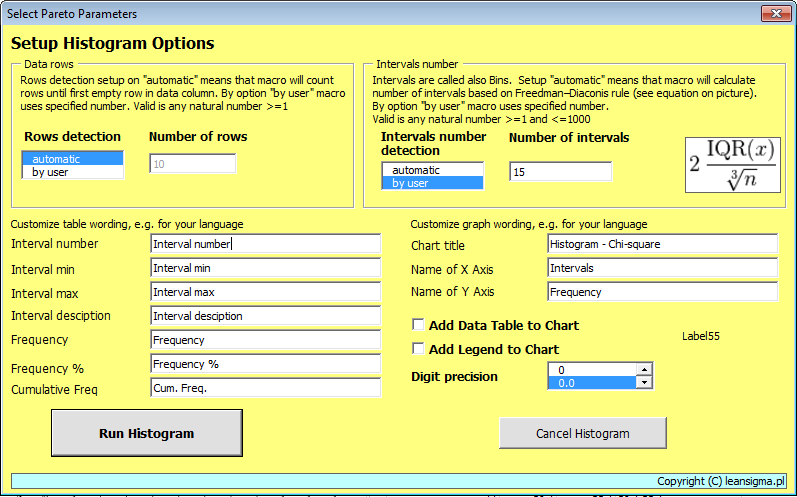
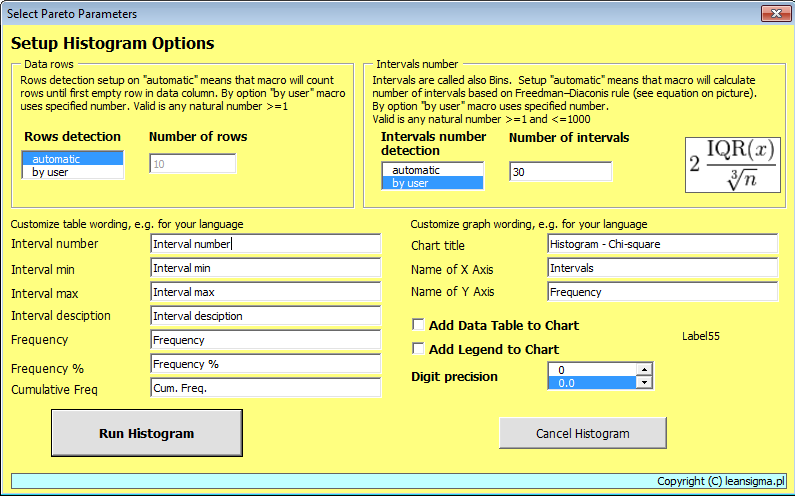
[Eng.] Below presented Histograms are created by Histogram program. To create diagram based on 100 000 data takes few seconds. The important chart's features like number of intervals, user description, data table, digits precision are controlled by program with the usage of dialog window. The most important is option of automatic selection of interval numbers. In this version the Freedman–Diaconis rule is used.